Look for the input and output first
Find the leftmost or bottommost input, then trace where the arrows eventually lead. That gives you the big picture before you worry about details.
Attention Is All You Need · 2026 A1
COMP10002 Foundations of Algorithms
How to read the block diagrams that often appear in Transformer and LLM papers, without getting lost in all the boxes and arrows.
When you see an LLM architecture figure in a paper, do not try to understand every box at once.
Read it as a data-flow diagram:
Most architecture figures are trying to show the shape of the computation, not the full implementation detail.
Start with the arrows.
They usually tell you the highest-level story:
tokens become embeddings
Then identify what kind of diagram it is.
Most paper figures are doing one of these jobs:
If you know which of those jobs the figure is doing, it becomes much easier to read.
Hover or focus the main boxes in the figure below for short plain-English explanations of the main parts.
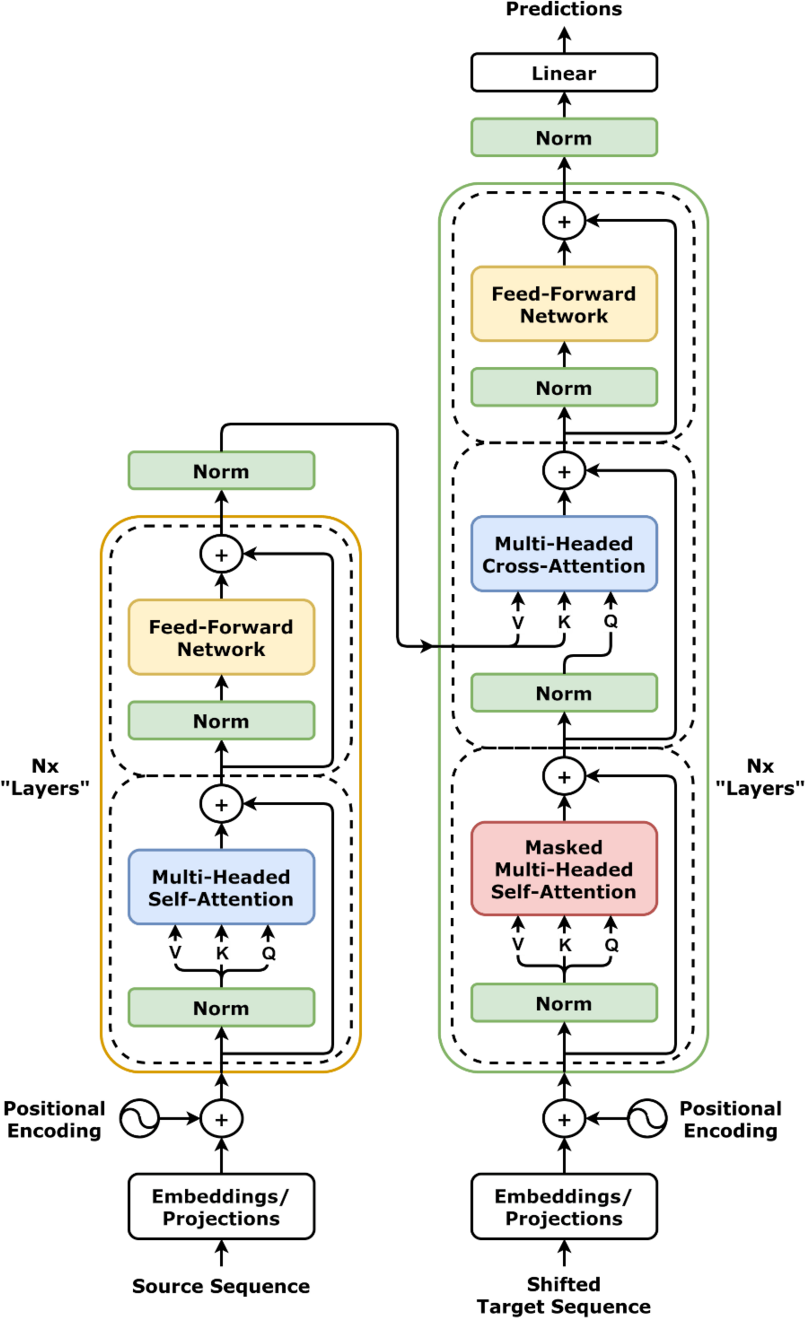
Find the leftmost or bottommost input, then trace where the arrows eventually lead. That gives you the big picture before you worry about details.
If a diagram says something like “×12”, “×24”, or “N layers”, it usually means “this same block is stacked many times”.
Labels such as “self-attention”, “feed-forward”, “add & norm”, or “MLP” are usually naming the role of a sub-computation, not giving all the loop details.
A common source of confusion is that one box in a paper figure may really stand for a large repeated stack.
For example, if you see:
× 12L layersthat usually means the model applies the same kind of block many times in sequence.
The figure is not claiming there is literally only one attention computation. It is compressing many similar layers into one readable visual unit.
That is the same reason papers often draw one attention block, one feed-forward block, and one output head even though the real implementation may involve:
Paper diagrams are helpful, but they often omit the details you would need to code the model directly.
What commonly gets suppressed:
This is why a paper figure can feel easy to look at but hard to implement from directly. The figure tells you the broad structure; the equations and prose carry the operational detail.
If you want the equation-side version of the same problem, read Reading Transformer paper notation.
The architecture diagrams in papers usually contain much more than this assignment asks you to implement.
In a typical LLM figure, your assignment corresponds to only a small middle slice:
Q, K, and VThat is why the Transformer explainer is useful before or after this page: it shows the larger block structure, while this page is about how to read the style of figure that papers tend to use.